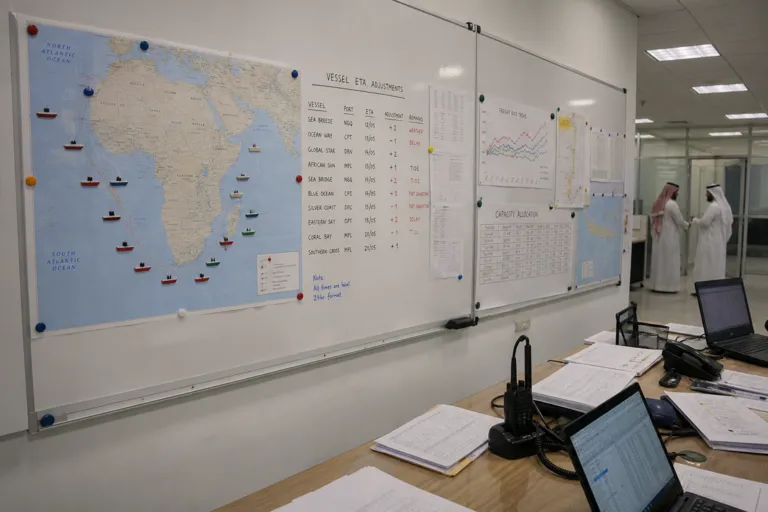
In 2026, Saudi importers are managing ocean supply chains shaped by an ongoing Red Sea security situation. Sources tracking the market week by week describe Houthi attacks continuing to disrupt the Bab el-Mandeb strait and making the route hard to insure at standard rates for most carriers. The operational outcome is consistent: major ocean carriers route many services around the Cape of Good Hope rather than transiting the Red Sea and Suez. This is not a minor tweak. The diversion adds roughly 3,000–3,500 nautical miles and extends voyages by about 10–14 days on key lanes such as Asia–Europe and Asia–US East Coast, reshaping schedule reliability and landed-cost planning for import programs.
The cost pressure is not only about distance. Longer voyages burn more fuel per container and also reduce the number of round trips each vessel can complete in a year, tightening effective capacity. One estimate for 2026 puts roughly 5–7% of the global container fleet tied up in Cape routing, described as equivalent to removing about 1.3–1.8 million TEU from the market. Another source, citing Xeneta, frames the structural drain differently, noting that longer sailing distances absorb around 2.5 million TEU of global capacity. Even when a Saudi importer’s lane does not directly transit the Red Sea, carriers shifting vessels toward busy mainline routes can still mean tighter space and knock-on rate pressure elsewhere.
What the 2026 Rate Tape Signals (and Why It Swings)
The 2026 container market is pulled in two directions at once: new capacity arriving, and disruption still distorting routing. One outlook projects 2026 newbuild deliveries of about 2.1–2.4 million TEU, described as roughly 8–10% of the existing fleet. Another forecast says a colossal order book representing more than 7 million TEUs of additional capacity was delivered between 2024 and 2026, leaving a 10%+ capacity surplus on main East–West routes. Yet rates can still move quickly because the Red Sea remains the wildcard. A market guide warns that any resolution or escalation of Red Sea tensions could shift rates by 20–30% in either direction within weeks, which is why contract strategies and budget buffers matter for Saudi importers.
Lane-level numbers show how disruption keeps a floor under pricing even in a market described as normalized. In January 2026, transpacific spot rates were listed at $2,200–2,800/FEU to the US West Coast and $3,400–4,200/FEU to the US East Coast, with FAK surcharges still volatile at $200–600/FEU depending on commodity. For Asia–Europe, current spot rates were cited at $3,500–4,500/FEU compared with $1,200–1,500 pre-disruption, and fuel surcharges (BAF) were described as $400–700/FEU of the premium. Separate tracking also noted that, as of January 2026, 26 containerships were sailing via the Suez Canal versus 175 via the Cape of Good Hope—evidence of how widespread rerouting remains.
For Saudi importers, managing Red Sea freight rate volatility in 2026 becomes a planning discipline, not a one-off response. Transit impacts are persistent: sources describe the Asia–Europe supply chain becoming 7–14 days longer due to Cape diversions, and planning guides summarize Cape routing as adding roughly 30–40% to total transit across many Asia–Europe lanes. That forces decisions about order timing, safety stock, and working-capital exposure when ETAs shift. It also means procurement teams need to read rate moves alongside capacity management tactics, such as coordinated scheduling and blank sailings, because the combination of longer voyages and carrier behavior can amplify short-window price swings.
Why are carriers still using Cape of Good Hope detours in 2026?
How much longer do shipments take when rerouted around the Cape of Good Hope?
What does Red Sea freight rate volatility mean for 2026 budgeting?
How much global container capacity is effectively tied up by the Cape diversion?
Talk to us for your needs in:
- Identifying Suitable Warehouse Sites in Saudi Arabia
- Customized Logistics and Supply Chain Analytics
- Logistics Network Design and Optimization
- Green Supply Chain and Sustainable Logistics Solutions
- Supply Chain Risk Management and Compliance
- Advanced Supply Chain Resilience and Agility
- Logistics Market Research and Strategic Analysis
- In-Depth Market Survey for Logistics
- Market Intelligence and Insights in Logistics
- Feasibility Study and Assessment in Logistics
- Integrated Warehousing Management Solutions
- Smart Warehousing and Automation Systems
- Sustainable and Green Warehousing Practices
- Port and Airport Logistics Optimization
- Digital Logistics Solutions
- Saudi Logistics Benchmarking